RT,SQL批量计算各个模型分的PSI
背景
应用模型的一大前提便是建模样本尽量和实际生产样本在分布上保持一致性,保证跨期层面的准确性
当模型分偏移到一定程度时,也该考虑迭代一版了
偏移程度 可以用 PSI 程度 业界有个经验值
PSI < 0.1: no significant population change
PSI < 0.2: moderate population change
PSI >= 0.2: significant population change
计算公式
关于PSI的详细介绍,可参考我司模型大佬的这篇文章
具体计算公式如下
$$PSI=\sum_{i=1}^{n}((Actual_i\% - Expected_i\%)\times \ln(\frac{Actual_i\%}{Expected_i\%}))$$
n 为分箱的个数
$Actual_i\%$ 表示第i个箱子的实际占比
$Expected_i\%$ 表示第i个箱子的预期占比,(称其为比较的基准)
计算样例
以某一个模型分为例,计算跨期的psi
bucket
excepted_num
except_rate
actual_num
actual_rate
psi
1
26780
0.1010
31779
0.1359
0.01036
2
26355
0.0994
27439
0.1173
0.00298
3
26532
0.1000
26008
0.1112
0.00118
4
27416
0.1034
25816
0.1104
0.00046
5
26495
0.0999
24113
0.1031
0.00010
6
26588
0.1002
23146
0.0990
0.00002
7
25957
0.0979
21176
0.0905
0.00057
8
27530
0.1038
21442
0.0917
0.00150
9
25898
0.0976
18310
0.0783
0.00428
10
25710
0.0969
14682
0.0628
0.01484
以上例子最终得到 $PSI=\sum_{i=1}^{10}(psi)=0.0362$
SQL实现
我们希望得到的是从存有各个模型分的表(命名为 score)得到上图👆,score表样例如下
no
week
scoreA
scoreB
scoreC
scoreD
scoreE
a1
9
617
481
773
671.68
561
a2
2
585
585
522
600.56
588
a3
16
617
548
677
635.68
563
a4
7
647
564
765
655.63
586
a5
12
596
478
656
635.3
586
a6
7
636
618
595
630
572
a7
22
714
572
842
644.28
563
a8
23
638
495
720
628.79
563
a9
3
636
618
595
426
526
a10
3
557
562
526
589
535
一行表示该用户对应的各种模型分数,scoreA…scoreE
其中, week 表示第几周,这里以2021年第一周([2021-01-04,2021-01-10])的数据作为基准,即 excepted
这里会涉及之前一些文章的知识点
整体思路还是跟着 PSI 的计算公式走,按照某种方式(等频 / 等距)将基准的数据分成 n 箱子,基于基准数据的断点(Breakpoint Value)统计实际占比($Actual$)
为了方便计算,先进行 列转行
将score表进行列转行,变为key-value 键值对的形式
 1
 2
 3
 4
 5
 6
 7
 8
 9
10
11
12
13
14
15
16
17
drop table if exists score_value_weekly ;
create table score_value_weekly as
select no
, week
, score
, score_value
from (
select no
, week
, score
, score_value
from score
lateral view explode ( map ( 'scoreA' , scoreA , 'scoreB' , scoreB , 'scoreC' , scoreC , 'scoreD' , scoreD , 'scoreE' , scoreE )) t as score , score_value
)
where score_value is not null
and score_value not in ( 'null' , 'NULL' )
;
2. 基于基准数据统计各箱nums
这里就要分成两种情况:
等频分箱
等距分箱
具体使用哪种分箱方式还是要结合模型分的实际应用情况
但是 ,当模型分呈现较为严重的偏态分布时,等频分箱会出现好几个箱子重合的情况(如下图所示)。这种情况算出来的PSI会小于真实值,此时可以采用等距分箱
等频分箱
 1
 2
 3
 4
 5
 6
 7
 8
 9
10
11
12
13
14
15
16
17
18
19
20
21
22
23
24
25
26
27
28
29
30
31
drop table if exists score_group_nums_weekly ;
create table score_group_nums_weekly as
select score
, week
, score_group
, count ( no ) as nums
from (
select a . *
, case when a . score_value <= r . score_array [ 0 ] then 'r1'
when a . score_value <= r . score_array [ 1 ] then 'r2'
when a . score_value <= r . score_array [ 2 ] then 'r3'
when a . score_value <= r . score_array [ 3 ] then 'r4'
when a . score_value <= r . score_array [ 4 ] then 'r5'
when a . score_value <= r . score_array [ 5 ] then 'r6'
when a . score_value <= r . score_array [ 6 ] then 'r7'
when a . score_value <= r . score_array [ 7 ] then 'r8'
when a . score_value <= r . score_array [ 8 ] then 'r9'
when a . score_value <= r . score_array [ 9 ] then 'r10' end as score_group
from score_value_weekly a
left join
( -- 2. 等频分箱
select score
, percentile_approx ( score_value , array ( 0 . 1 , 0 . 2 , 0 . 3 , 0 . 4 , 0 . 5 , 0 . 6 , 0 . 7 , 0 . 8 , 0 . 9 , 1 ), 99999 ) as score_array
from score_value_weekly
where week = 1 -- 以第一周为基准
group by 1
) r
on a . score = r . score
)
group by 1 , 2 , 3
;
等距分箱
等距分箱相比等频分箱而言稍微复杂点,我的思路是先算出基准数据各个模型分区间的上下限,再统计各箱nums
 1
 2
 3
 4
 5
 6
 7
 8
 9
10
11
12
13
14
15
16
17
18
19
20
21
22
23
24
25
26
27
28
29
30
31
32
33
34
35
36
37
38
39
40
41
42
43
44
45
46
47
48
49
50
51
52
53
54
55
-- 10个箱子
-- -- 统计各箱nums
drop table if exists score_group_nums_weekly ;
create table score_group_nums_weekly as
select score
, week
, n as score_group
, count ( no ) as nums
from (
select a . *
, r . n
, case when a . score_value >= r . range_down and a . score_value < r . range_up then 'Y'
when a . score_value = r . range_up then 'Y' else 'N' end as is_range
from score_value_weekly a
left join
( -- 基准月各分数间隔
select score
, n
, min_score
, max_score
,( min_score + ( n - 1 ) * step ) as range_down
,( min_score + n * step ) as range_up
from (
select a . *
-- 10 箱
, case when a . score_value = b . min_score then 1
else ceil ( 10 * ( a . score_value - b . min_score ) / ( b . max_score - b . min_score )) end as n
, b . min_score
, b . max_score
, b . step
from (
select *
from score_value_weekly
where week = 1
) a
left join
(
select score
, min ( score_value ) as min_score
, max ( score_value ) as max_score
-- 10 个箱子
,( ( max ( score_value ) - min ( score_value )) / 10 ) as step
from score_value_weekly
where week = 1
group by 1
) b
on a . score = b . score
)
group by 1 , 2 , 3 , 4 , 5 , 6
) r
on a . score = r . score
)
where is_range = 'Y'
group by 1 , 2 , 3
;
3. 计算PSI
回顾下公式
$$PSI=\sum_{i=1}^{n}((Actual_i\% - Expected_i\%)\times \ln(\frac{Actual_i\%}{Expected_i\%}))$$
 1
 2
 3
 4
 5
 6
 7
 8
 9
10
11
12
13
14
15
16
17
18
19
20
21
22
23
24
25
26
27
28
29
30
31
32
33
34
35
36
37
38
39
40
41
42
43
44
45
46
47
48
49
50
51
52
53
54
55
56
drop table if exists score_stability_result_weekly ;
create table score_stability_result_weekly as
select a . *
, b . psi
from ( -- 各箱nums
select score
, week
, score_group_value [ "r1" ] as r1
, score_group_value [ "r2" ] as r2
, score_group_value [ "r3" ] as r3
, score_group_value [ "r4" ] as r4
, score_group_value [ "r5" ] as r5
, score_group_value [ "r6" ] as r6
, score_group_value [ "r7" ] as r7
, score_group_value [ "r8" ] as r8
, score_group_value [ "r9" ] as r9
, score_group_value [ "r10" ] as r10
from ( -- 行转列
select score
, week
, str_to_map ( concat_ws ( ',' , collect_set ( concat_ws ( ':' , score_group , nums )))) as score_group_value
from score_group_nums_weekly
group by 1 , 2
)
) a
left join
( -- psi
select f . score
, f . week
, sum ( ( f . act_rate - b . exp_rate ) * log ( f . act_rate / b . exp_rate ) ) as psi
from ( -- Actual
select score
, week
, score_group
,( nums / sum ( nums ) over ( partition by score , week ) ) as act_rate
from score_group_nums_weekly
where week > 1
) f
left join
( -- Excepted
select score
, week
, score_group
,( nums / sum ( nums ) over ( partition by score , week ) ) as exp_rate
from score_group_nums_weekly
where week = 1
) b
on ( f . score = b . score
and f . score_group = b . score_group )
where f . score_group is not null
and f . score_group not in ( 'null' , 'NULL' )
group by 1 , 2
) b
on ( a . score = b . score
and a . week = b . week )
;
可视化
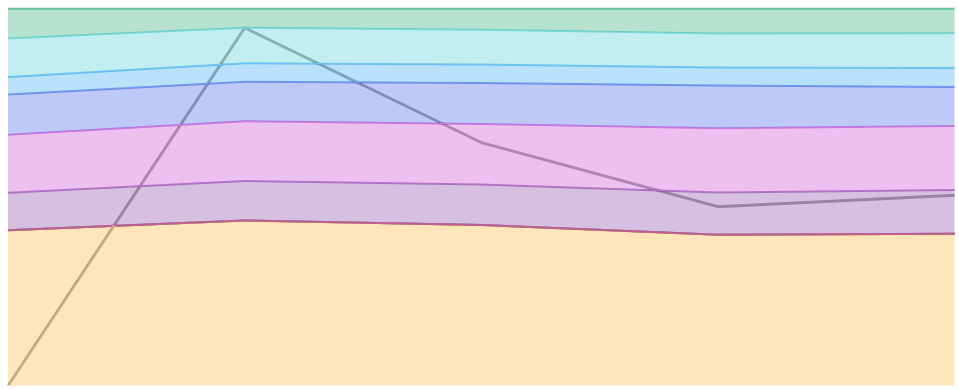
最后,可以用Excel或BI软件完成对应的可视化
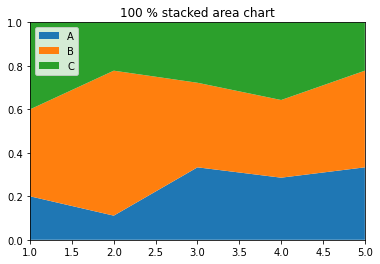
本文选择的是面积图
Python代码示例
 1
 2
 3
 4
 5
 6
 7
 8
 9
10
11
12
13
14
15
16
17
18
# libraries
import numpy as np
import matplotlib.pyplot as plt
import seaborn as sns
import pandas as pd
# Make data
data = pd . DataFrame ({ 'group_A' :[ 1 , 4 , 6 , 8 , 9 ], 'group_B' :[ 2 , 24 , 7 , 10 , 12 ], 'group_C' :[ 2 , 8 , 5 , 10 , 6 ], }, index = range ( 1 , 6 ))
# We need to transform the data from raw data to percentage (fraction)
data_perc = data . divide ( data . sum ( axis = 1 ), axis = 0 )
# Make the plot
plt . stackplot ( range ( 1 , 6 ), data_perc [ "group_A" ], data_perc [ "group_B" ], data_perc [ "group_C" ], labels = [ 'A' , 'B' , 'C' ])
plt . legend ( loc = 'upper left' )
plt . margins ( 0 , 0 )
plt . title ( '100 % s tacked area chart' )
plt . show ()
area chart
总结
本文主要是提供了通过SQL计算多个模型分PSI的方案,并采用了等频、等距分箱两种分箱方法,增加了适用性
Reference


 胡子叔叔的小站